Bloom Forecast Apr 08 - Apr 15, 2022
Below are pie charts describing the probability of a cyanobacterial bloom. The one on the left describes the predictions from two weeks ago, and the one on the right describes the latest prediction, for the coming week.
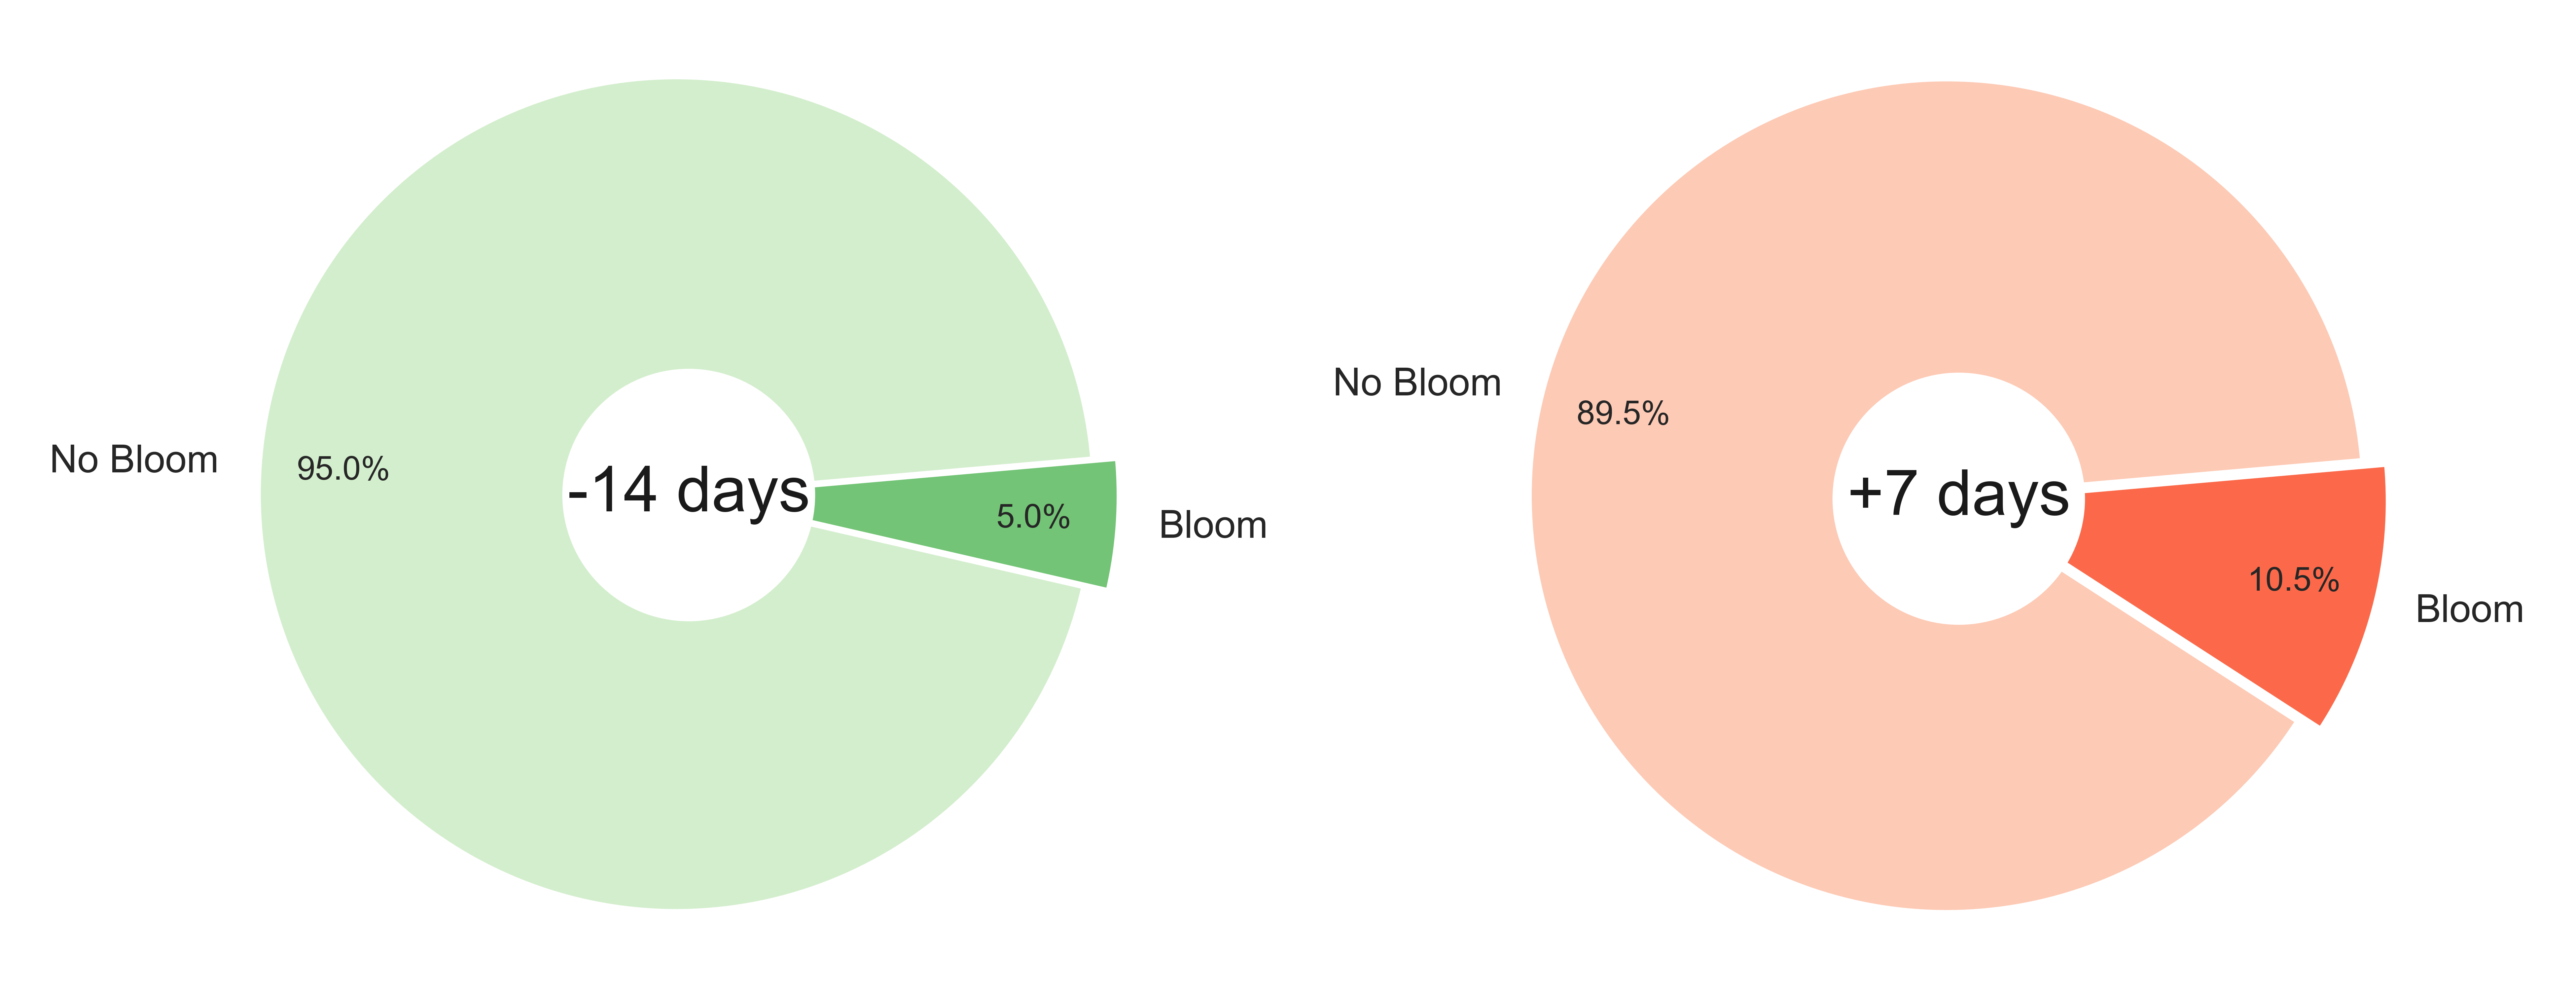 Probability of occurrence (%) of an algal bloom from two weeks ago (left) and for the next 7 days (right).
Hotspot Analysis
This map shows you the latest estimates of chlorophyll-a from the Sentinel 2a satellite. Note that the color scale is normalized to highlight the relative hotspots in the image. The colorscale does not provide an indication of the absolute amount of chlorophyll-a in the water (i.e., the map will still highlight hotspots in the winter, even if the absolute level of chlorophyll-a is low).
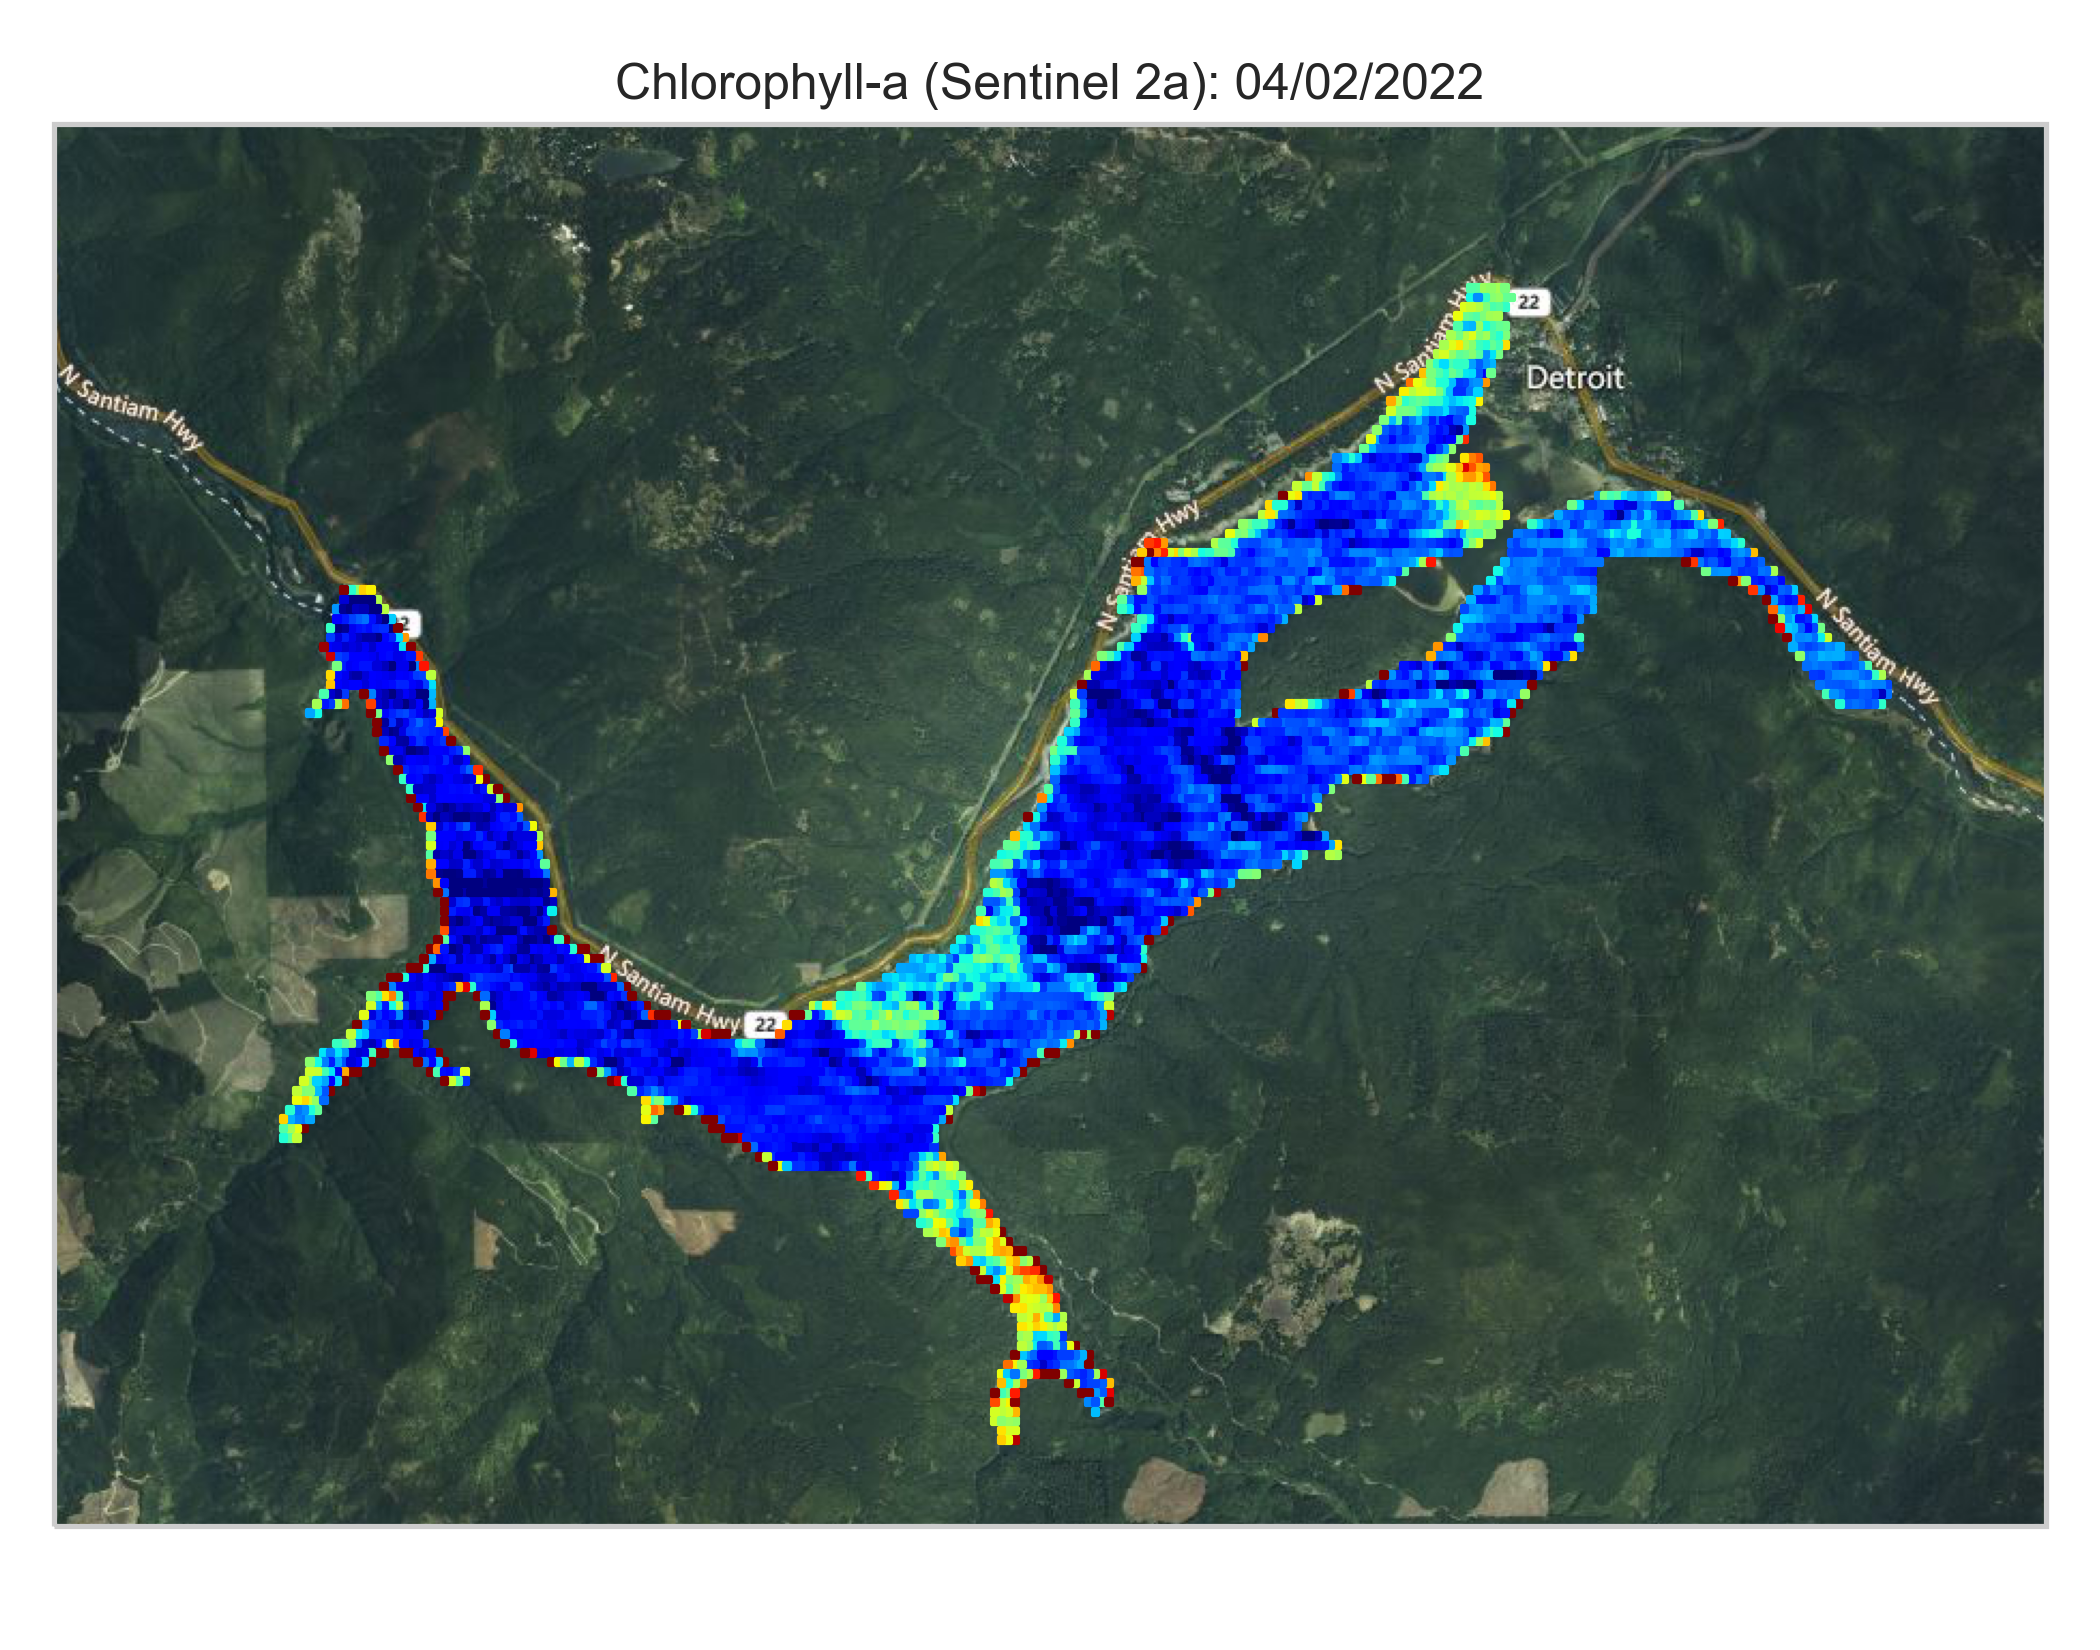
Latest chlorophyll-a map from the Sentinel 2a satelllite.
Where we are in the season
This plot shows the historical expectation for HAB risk over the year. Use this chart to see where we are in the season (identified by the vertical red line).
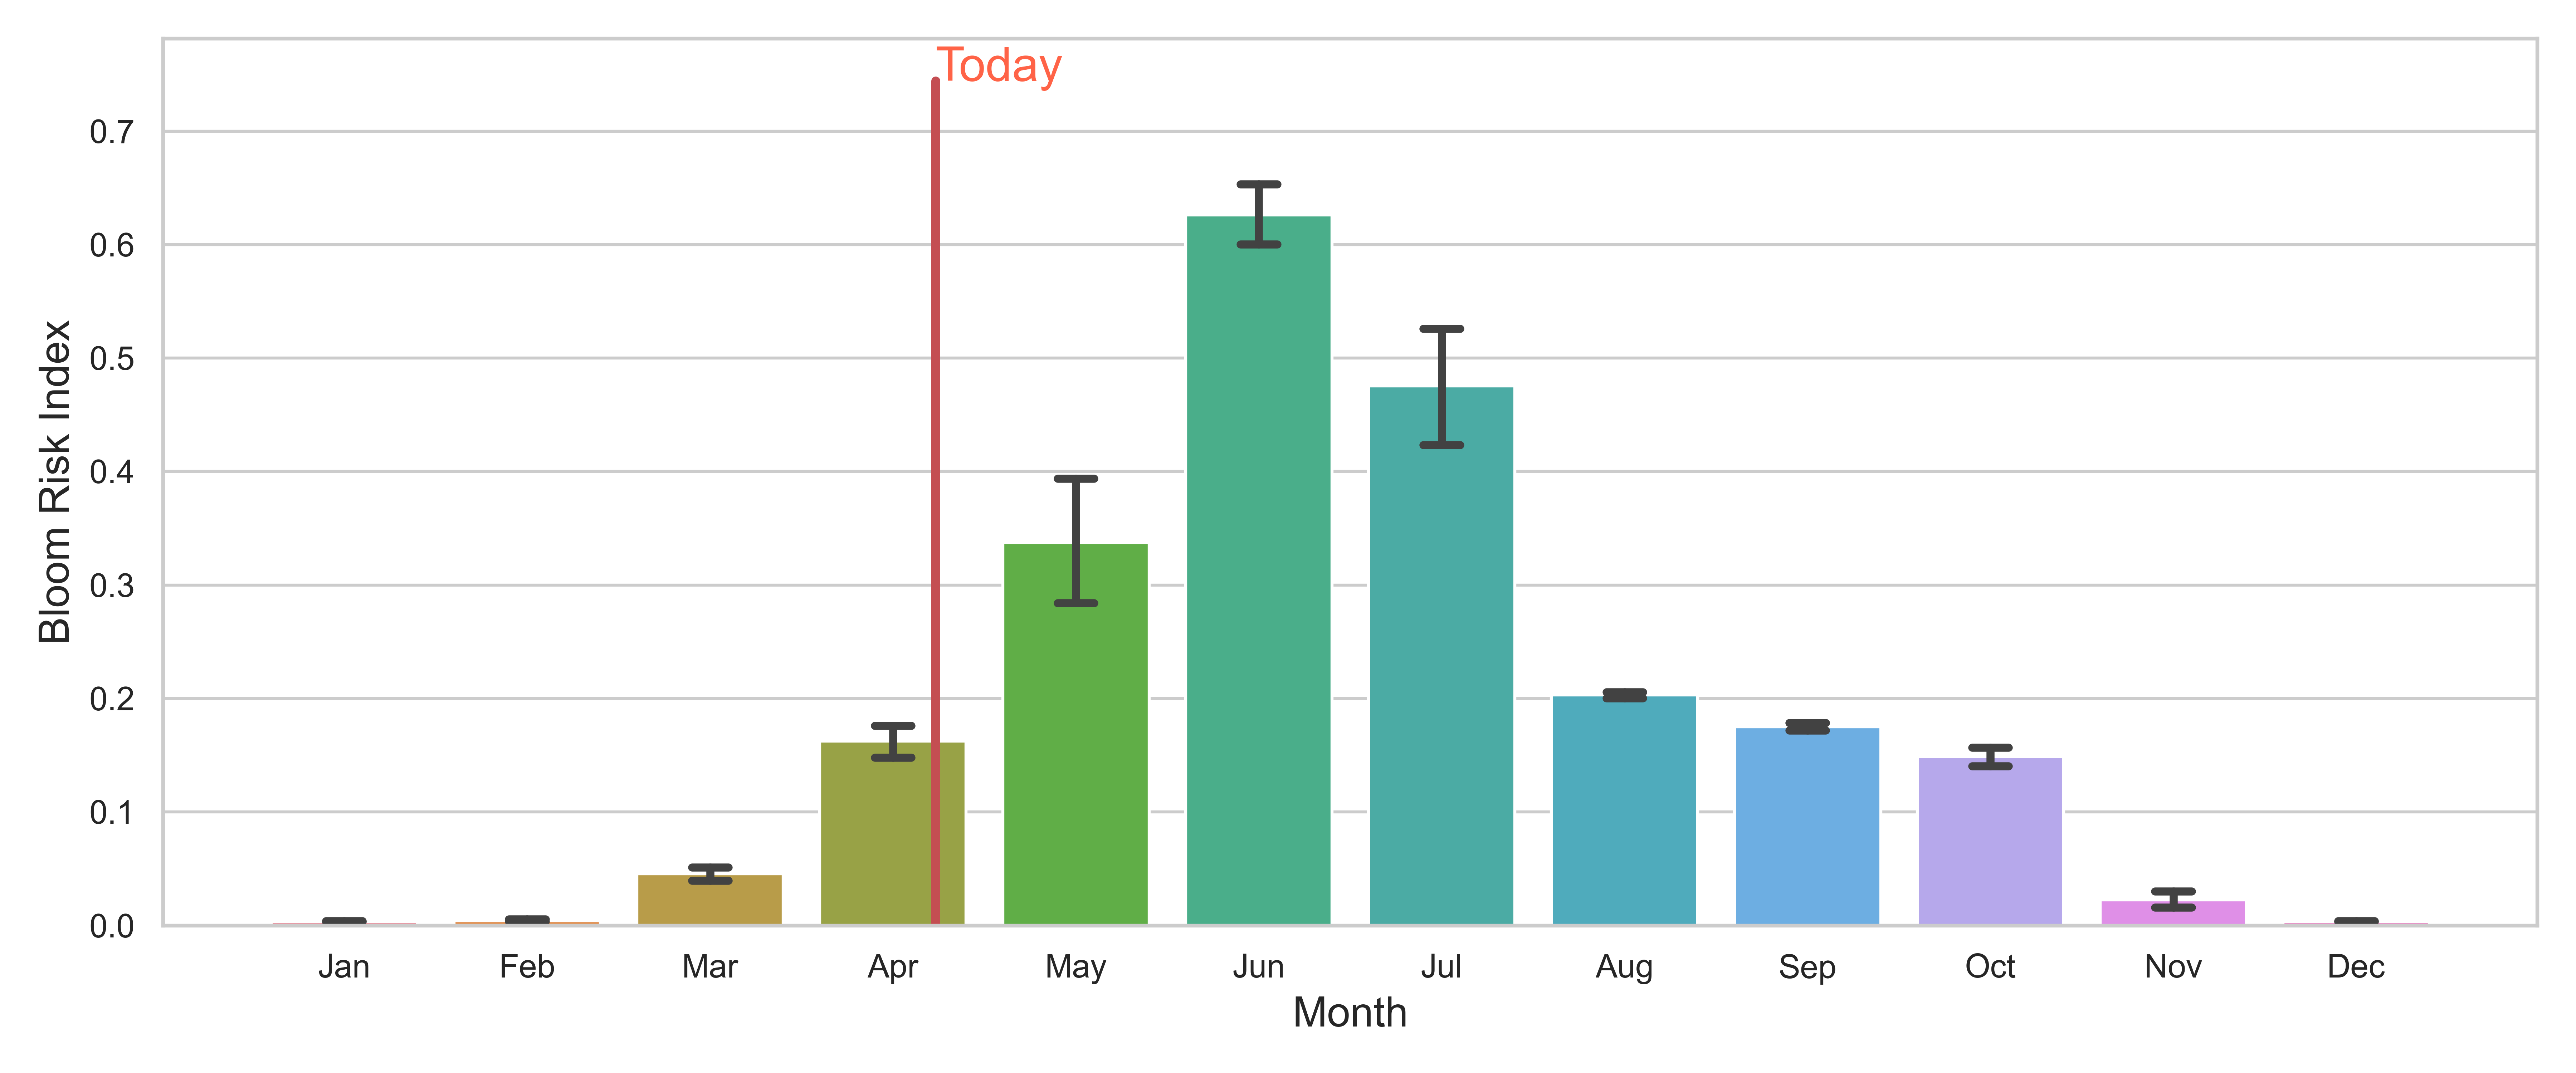 Harmful algal bloom risk over the year.
How rainy has it been?
We know that in general certain weather conditions promote the likelihood of HABs. Check this chart to see
how wet it is, relative to past years. This is simply adding up each day’s rainfall, for each year. If the red line is below the orange line, then this year is dryer than average.
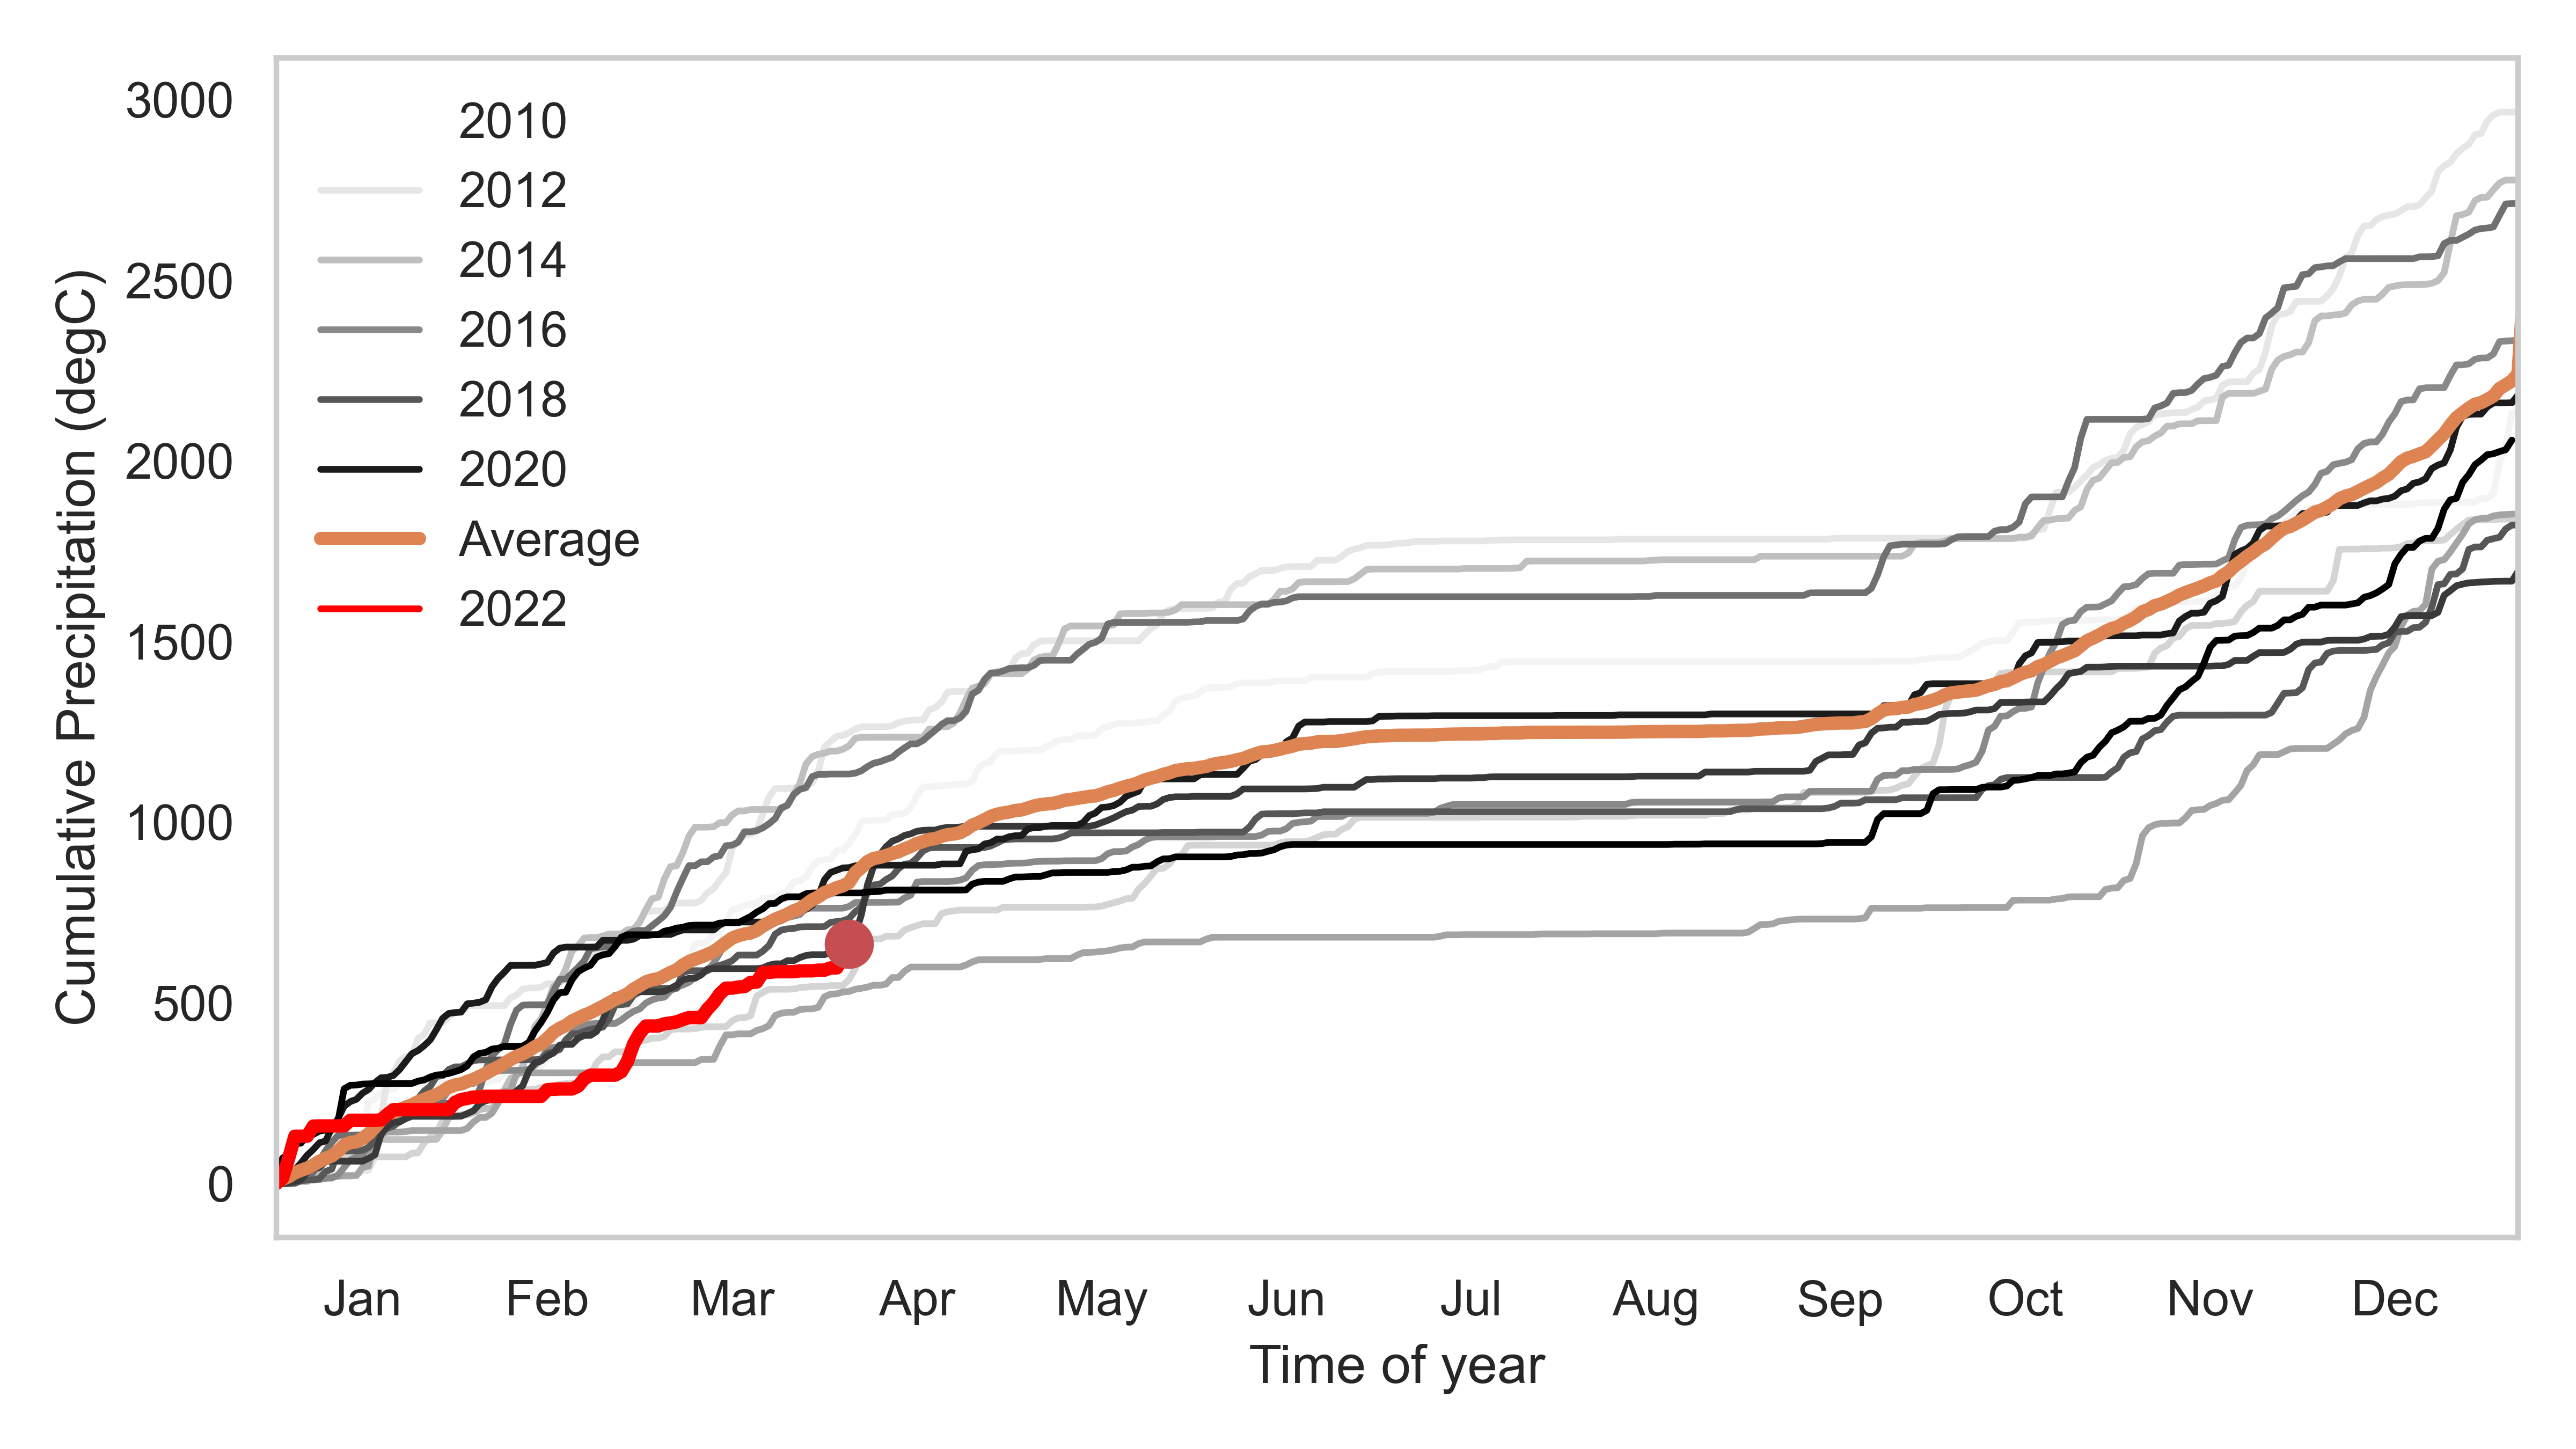 Precipitation at the lake compared to previous years.
How hot has it been?
We know that in general certain weather conditions promote the likelihood of HABs. Check this chart to see
how hot it is, relative to past years. This is simply adding up each day’s temperature, for each year. If the red line is above the orange line, this year is hotter than average.
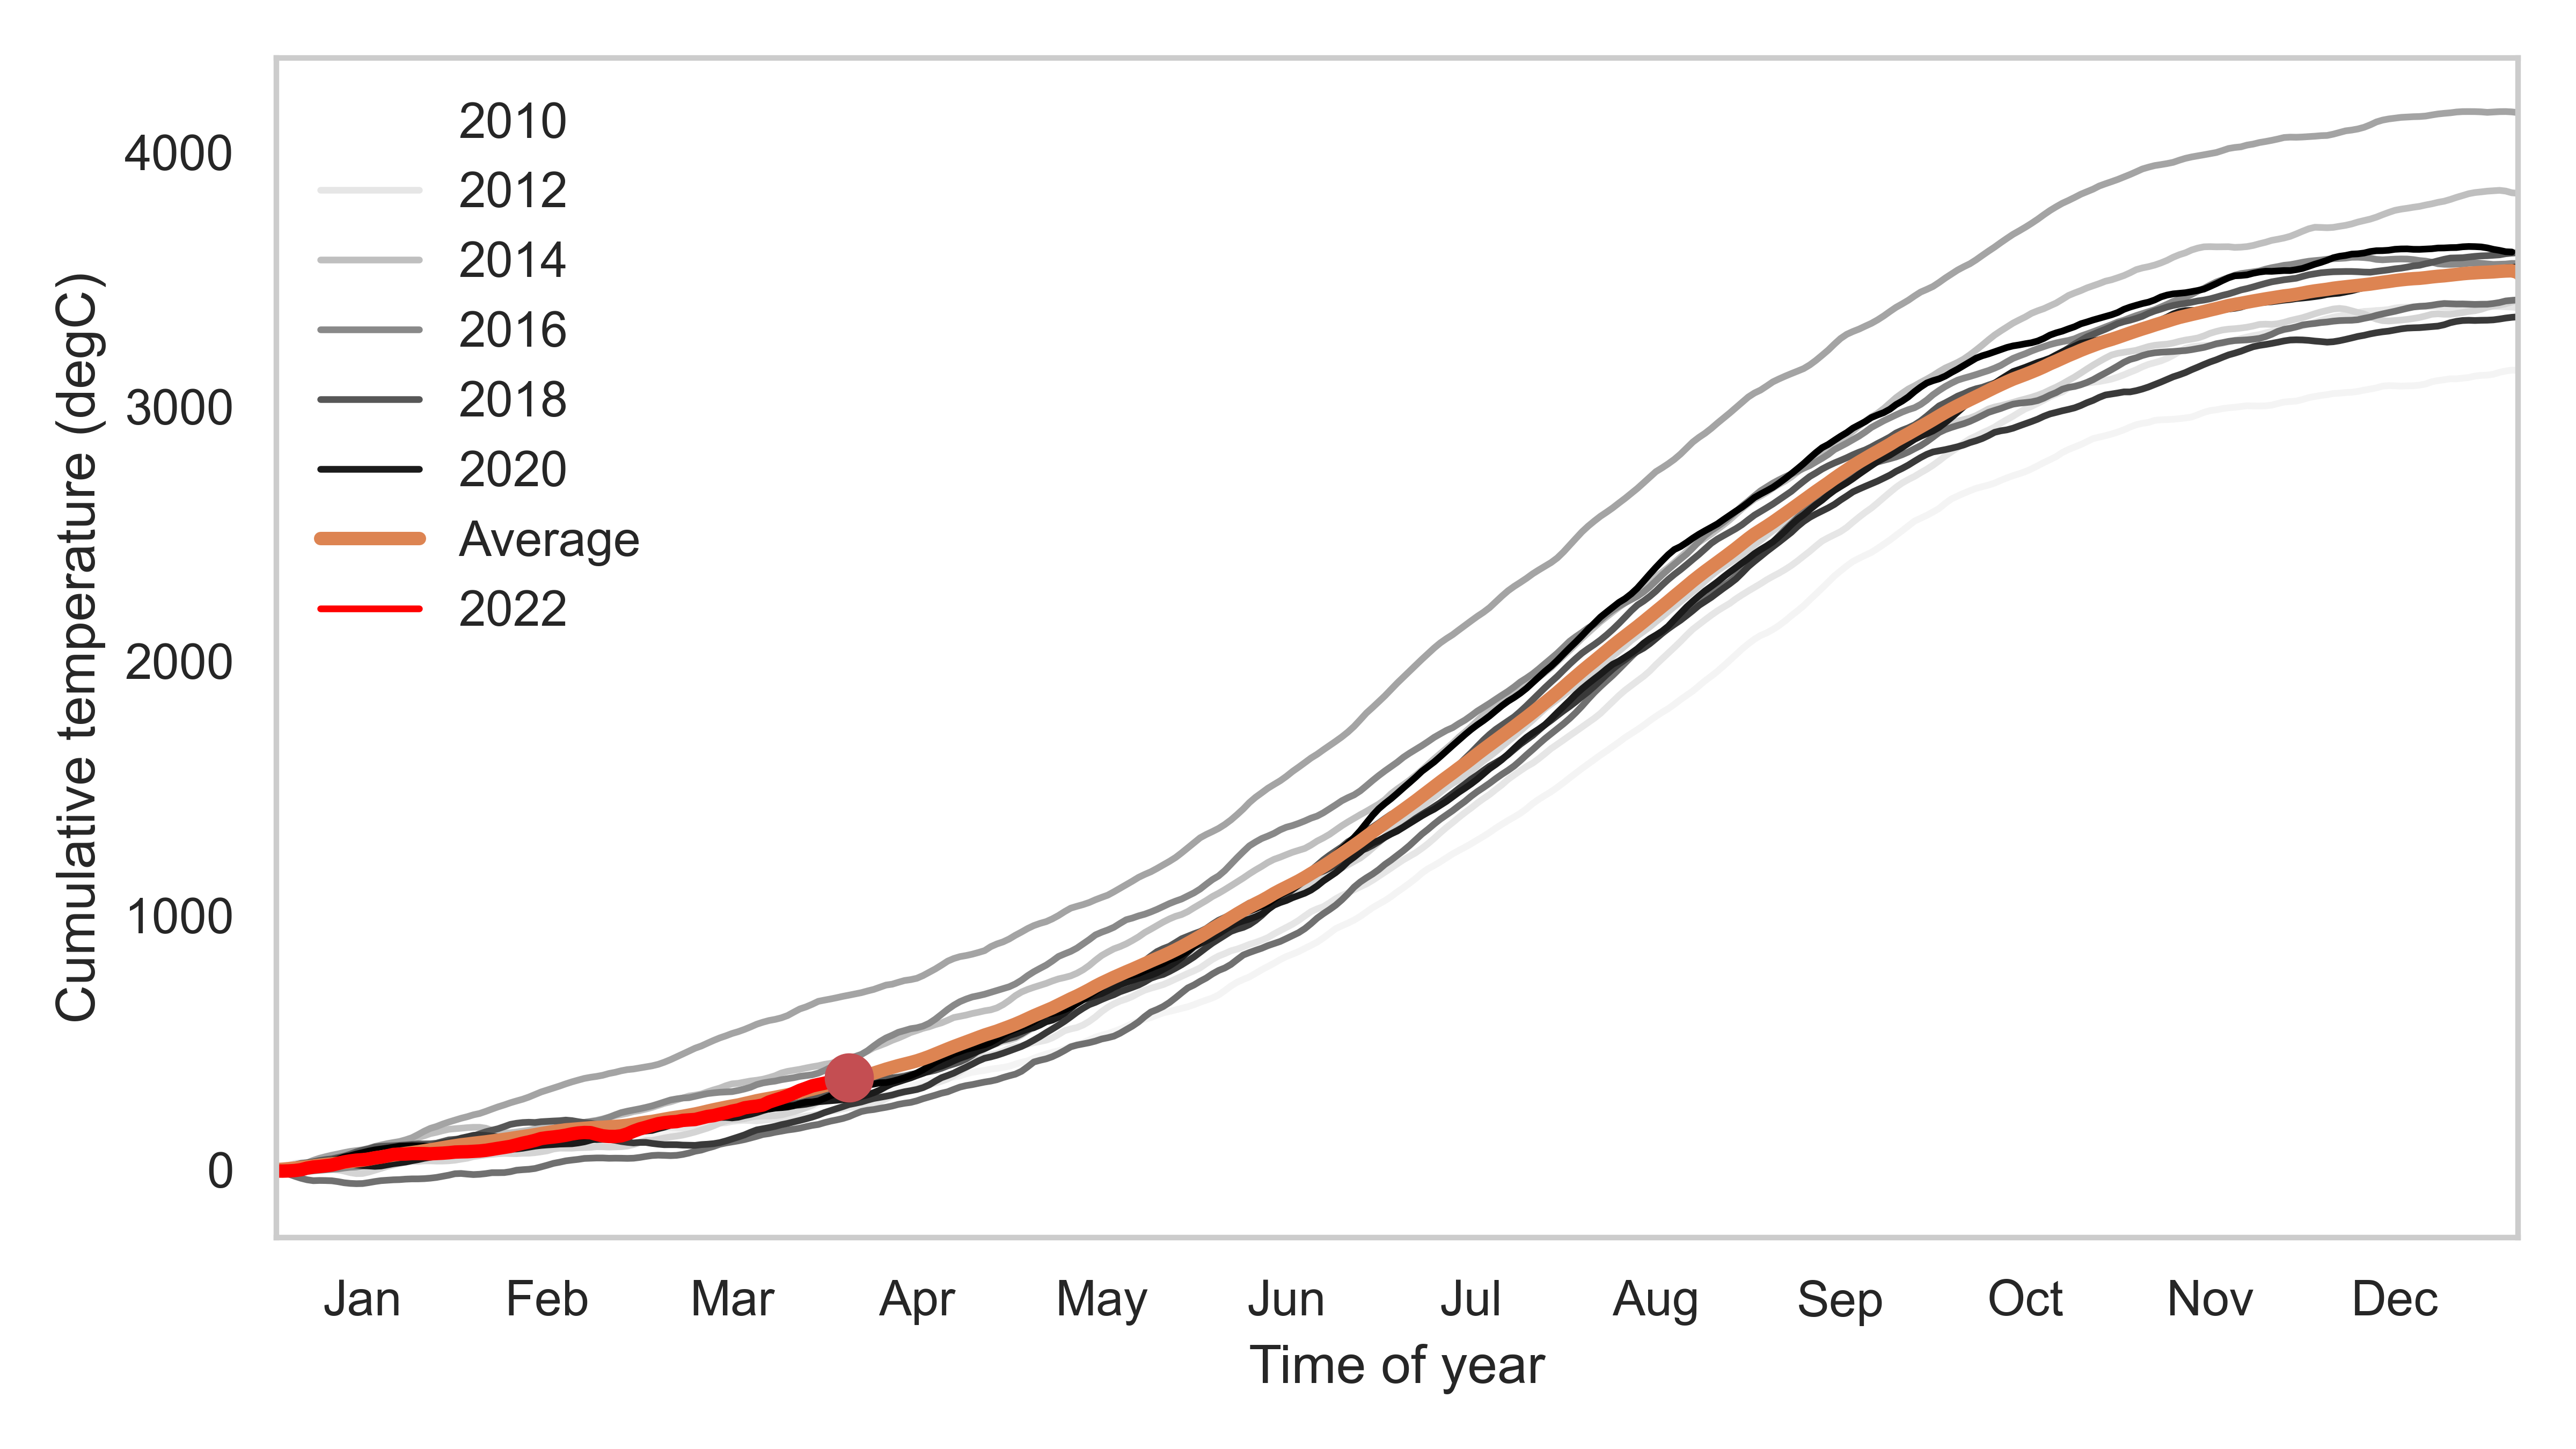 Air temperature at the lake compared to previous years.